When it comes to the health of his state's economy, California Governor Jerry Brown has been walking on eggshells this year.
Twice each year, once in January and again in May, Gov. Jerry Brown warns Californians that the economic prosperity their state has enjoyed in recent years won't last forever.
Brown attaches his admonishments to the budgets he proposes to the Legislature – the initial one in January and a revised version four months later.
Brown's latest, issued last May, cited uncertainty about turmoil in the national government, urged legislators to "plan for and save for tougher budget times ahead," and added:
"By the time the budget is enacted in June, the economy will have finished its eighth year of expansion – only two years shorter than the longest recovery since World War II. A recession at some point is inevitable."
It's certain that Brown will renew his warning next month. Implicitly, he may hope that the inevitable recession he envisions will occur once his final term as governor ends in January, 2019, because it would, his own financial advisers believe, have a devastating effect on the state budget.
Unfortunately for Governor Brown, the recession he fears may already have arrived in California.
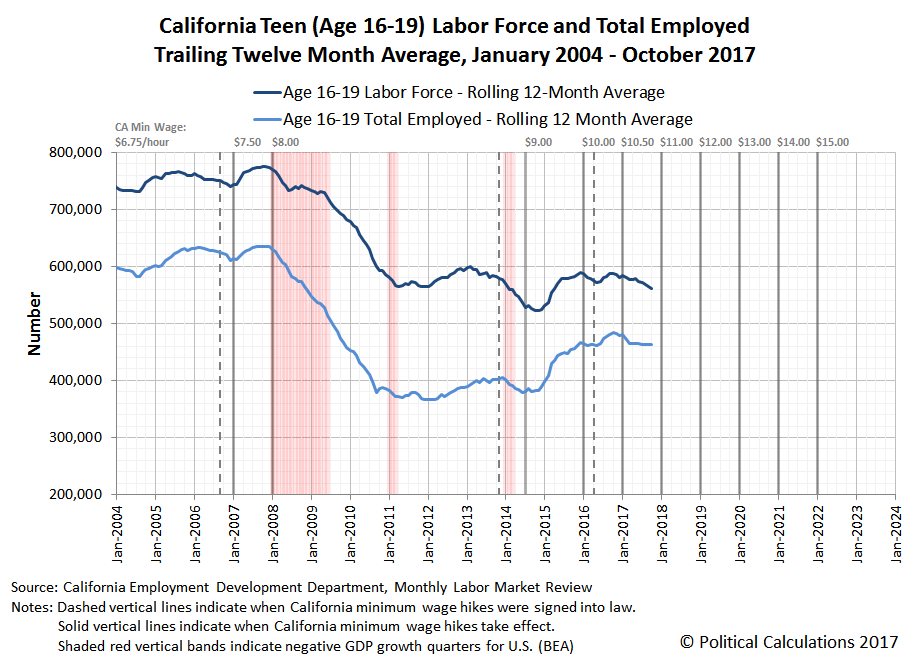
The following chart showing the trailing twelve month averages of California's civilian labor force and number of employed is one that we've adapted from a different project to show that data in the context of the state's higher-than-federal minimum wage increases and periods of negative GDP growth for the national economy. It shows that in 2017, the size of the state's labor force has peaked and begun to decline in 2017, while the number of employed shows very slow to stagnant growth during the year.
The data for this chart is taken from the summary tables for the state's monthly reports on the California Demographic Labor Force, which are produced by California's Employment Development Department. These are therefore the same numbers that Governor Brown sees, and they have been signaling throughout 2017 that the state's economy is going through a period of stagnation after having generally grown since bottoming in mid-2011 following the Great Recession.
The labor force and employment numbers aren't telling the full story however, which becomes evident when we factor in the state's growing population. The following chart shows the labor force and employment to population ratios for the state's civilian work force.
In this chart, we find that California's employment to population ratio peaked at 59.2% in December 2016, having slowly declined to 59.0% through October 2017. Meanwhile, California's labor force to population ratio last peaked at 62.6% in October 2016, which has since dropped to 62.1% a year later.
Going by these measures, it would appear that recessionary conditions have arrived in California, which is partially borne out by state level GDP data from the U.S. Bureau of Economic Analysis:
Last year was a very good one for the state’s economy. The 3.3 percent gain in economic output in 2016 was more than double that of the nation as a whole and one of the highest of any state.
However, California stumbled during the first half of 2017. California’s increase was an anemic six tenths of one percent in the first quarter compared to the same period of 2016, and 2.1 percent in the second quarter, well below the national rate and ranking 35th in the nation.
The report revealed that almost every one of California’s major sectors fell behind national trends in the second quarter, with the most conspicuous laggard being manufacturing.
On a final note, the charts we've featured above were adapted from our project tracking the impact of California's minimum wage hikes on its teen labor force, where we've been following that labor force and employment data since July 2003 (which hopefully helps explain why the trailing 12 month labor force and employment to population ratio chart starts showing data beginning in June 2004). As bad as the charts above are for California's labor force, the employment situation for California's teens is much worse, having itself peaked in October 2016.
California's teens are best thought of as being the proverbial canaries in the coal mine.
Update 26 December 2017 11:41 AM PST: Changed "recession has" to "recessionary conditions have" above (about six paragraphs up), which better describes how we're considering the data that we've seen to date. Also, if you came to this article by way of ZeroHedge, which has rather completely surprised us in recent weeks by picking up and republishing a number of our recent posts (including two on the topic of Philadelphia's soda tax), our outlook for the state of the economy is not anywhere near as gloomy, doomy or as conspiratorial as the worldview that we associate with a lot of ZH's content.
That said, even though the republished articles have come without any coordination or even notice, we appreciate the Tyler Durdens making some of our content available to their estimated 4 million unique readers each month. And though they might have the most dismal outlooks of all, at least they're not some strange breed of creepy cyber-stalkers!
Labels: recession
Welcome to the blogosphere's toolchest! Here, unlike other blogs dedicated to analyzing current events, we create easy-to-use, simple tools to do the math related to them so you can get in on the action too! If you would like to learn more about these tools, or if you would like to contribute ideas to develop for this blog, please e-mail us at:
ironman at politicalcalculations
Thanks in advance!
Closing values for previous trading day.
This site is primarily powered by:
CSS Validation
RSS Site Feed
JavaScript
The tools on this site are built using JavaScript. If you would like to learn more, one of the best free resources on the web is available at W3Schools.com.


